The Signal Edition: Same Shock, Two Barrels
One barrel is pricing a war. The other is drowning in American shale. The gap between them is the most honest number on the screen this week.

Last week the desks watched Brent, called it an energy market, and moved on. They were looking at one barrel and ignoring the other. There is no single energy trade right now. There are two, and they are walking in opposite directions.
A NOTE BEFORE WE START
Thirty seconds, then the analysis.
If you are reading the Pipeline, you work in or around energy, and you already know how most desk research is written. It is written to sell you something. This is not. I run a brokerage, I move physical barrels, and I write this because the read I wanted did not exist. No bank owns it. No advertiser shapes it. Nobody pays to be in it.
Here is the exchange, in plain terms. The Monday Signal is free, in full, every week. What keeps it independent is the readers who upgrade, and the upgrade is where the trades, the scenarios, and the desk packs sit on Wednesday and Friday.
Most of the people who read this every week are not subscribed. If you are one of them, this is the nudge. Free keeps you in the room. Paid gives you the position.
Felipe Vigne Germini
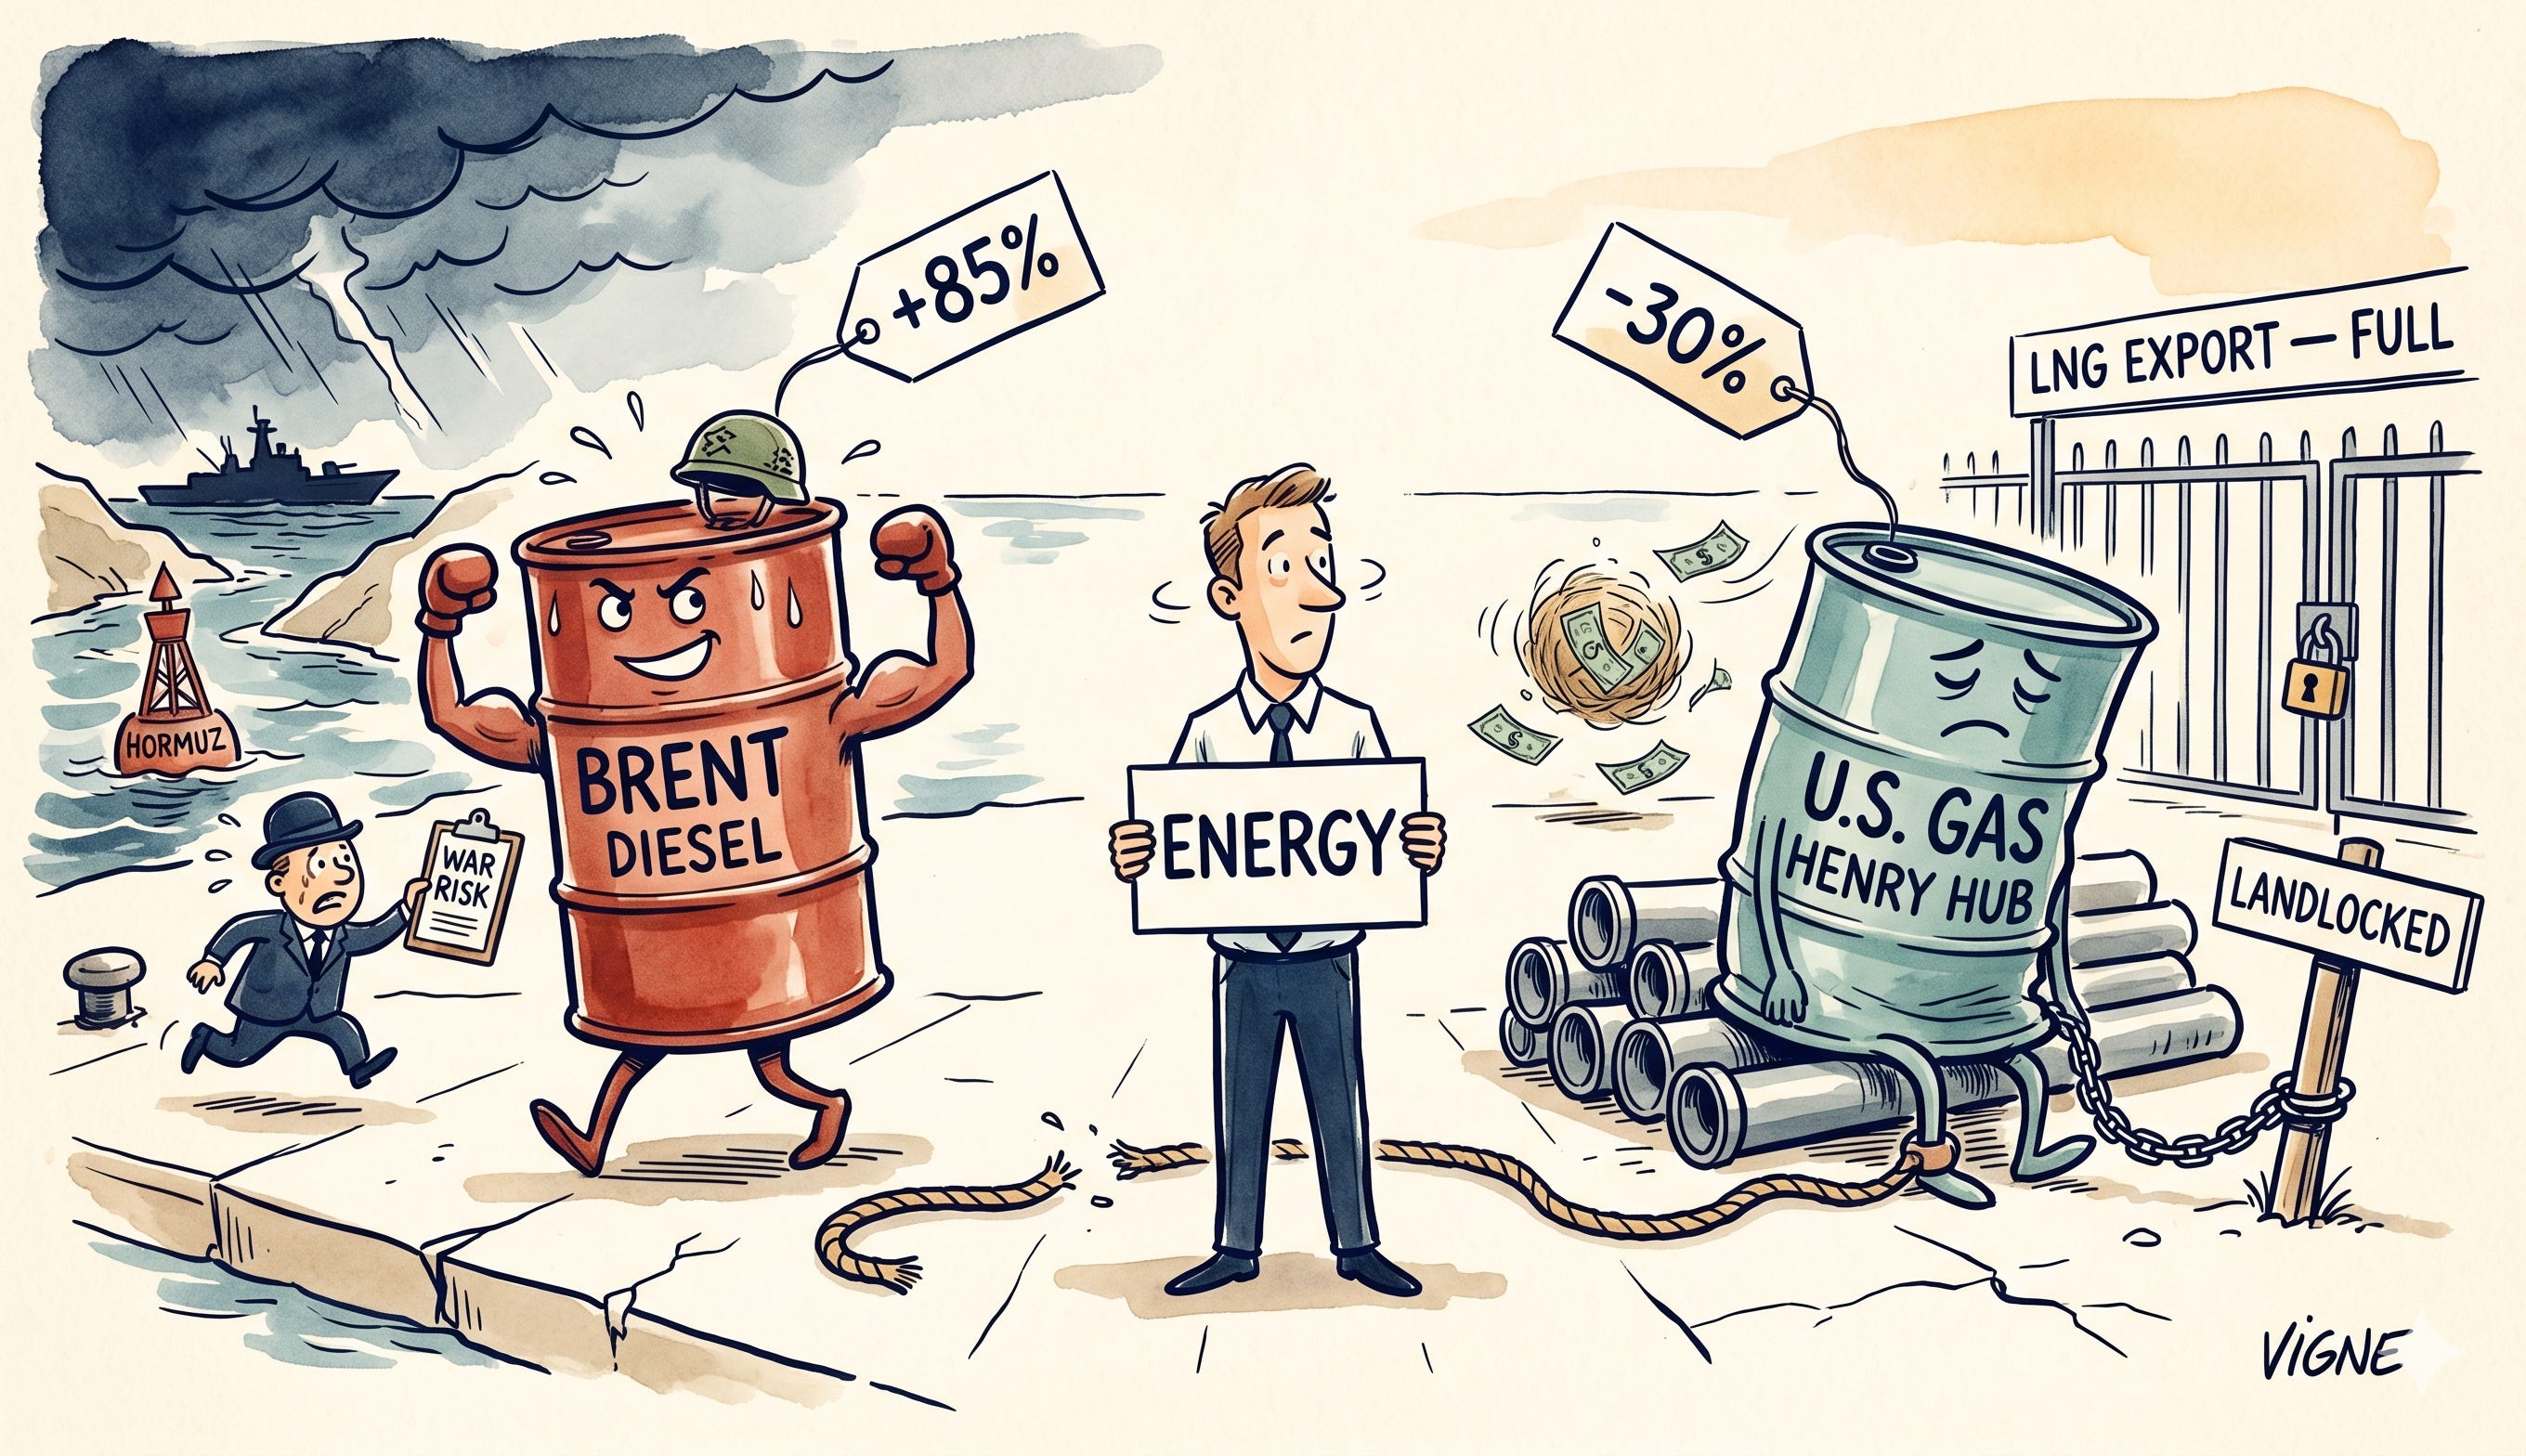
The oil complex is up hard on the year. The American gas barrel is down hard. Same calendar, same headlines, same so-called energy bull market, and a spread between the two that has rarely been this wide. When two barrels that usually move together split this far apart, the market is telling you something specific about what kind of shock this actually is. This one is geopolitical, it is seaborne, and it is about oil. It is not an energy shock. The gas barrel proves it.
The numbers do not rhyme
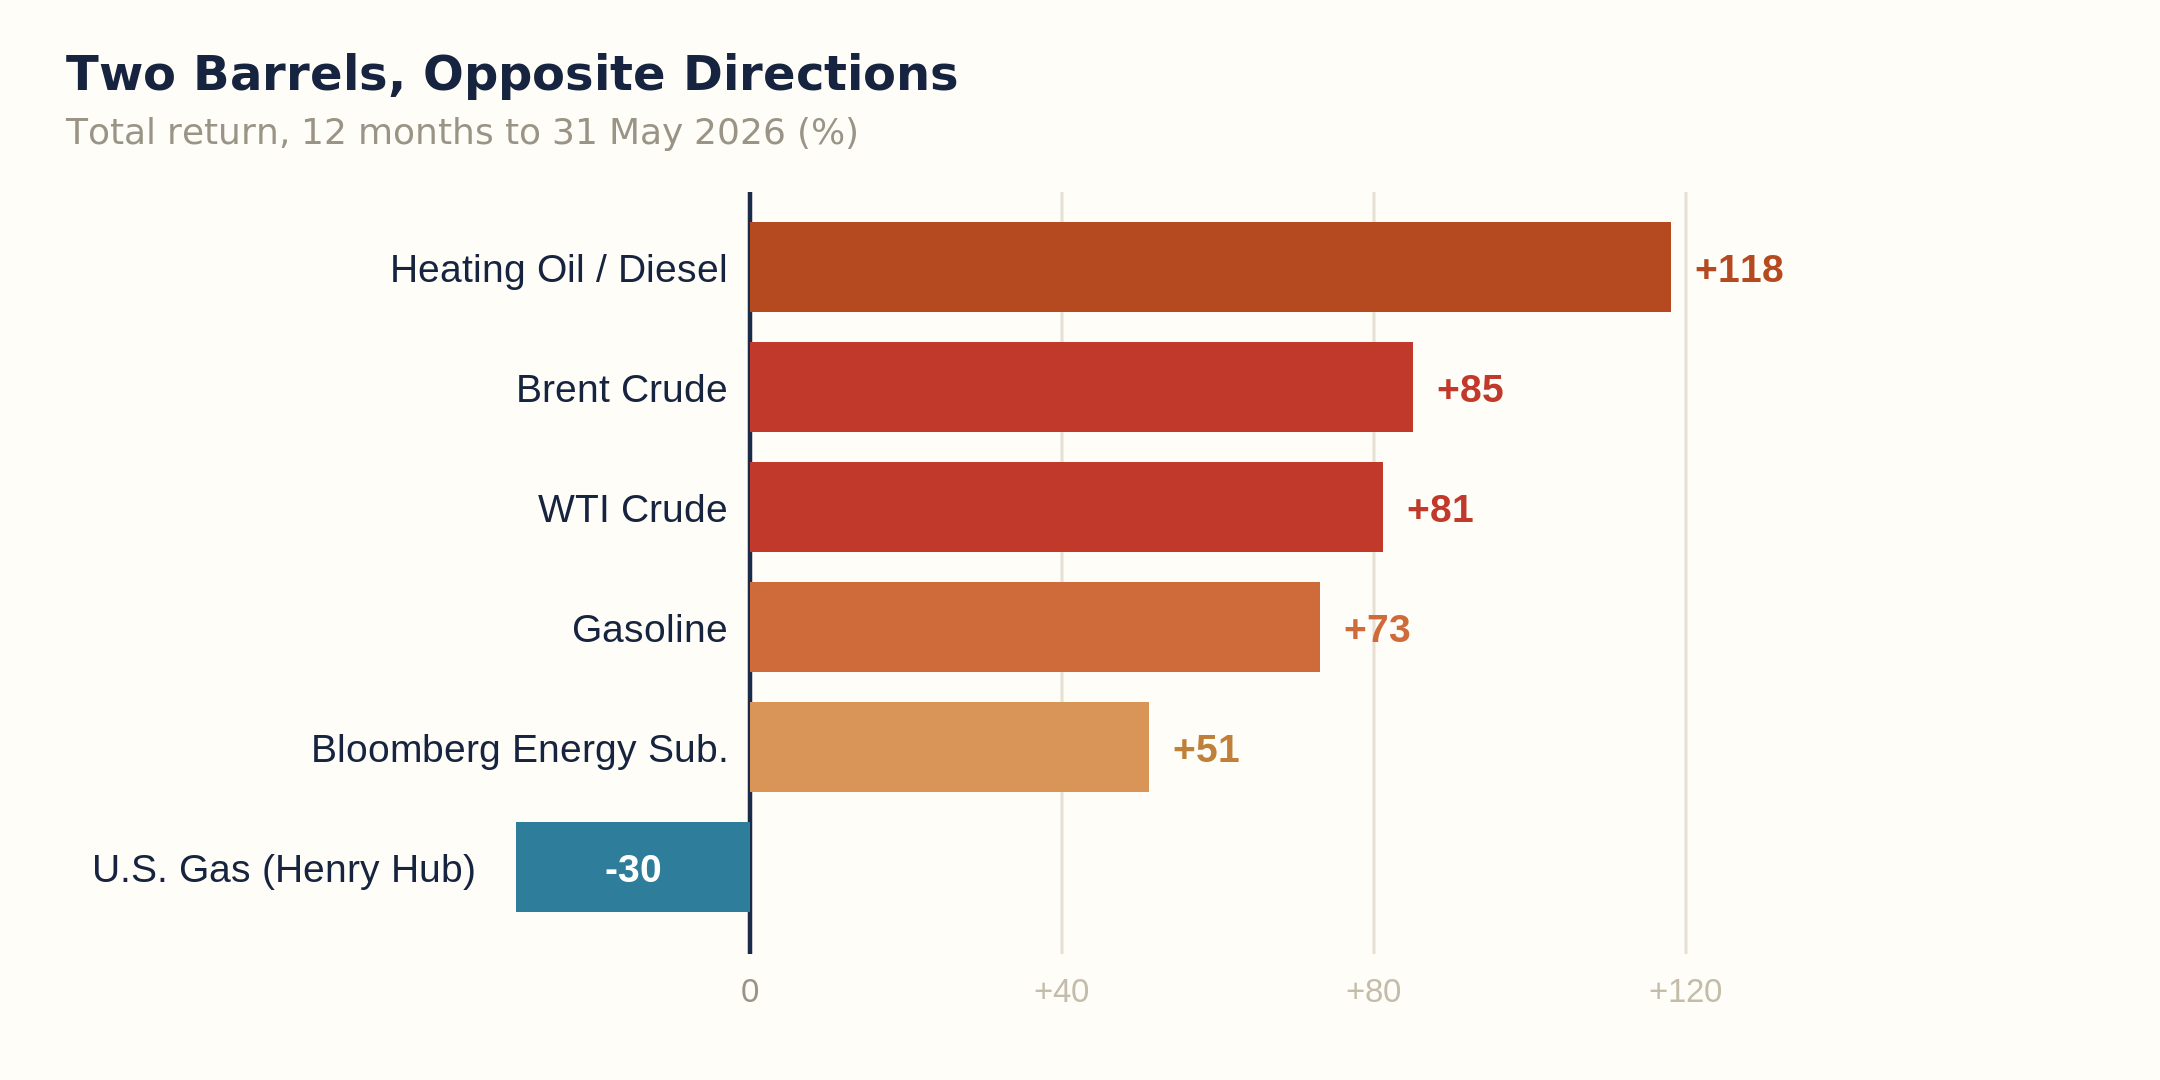
Run the tape. Over the last twelve months Brent is up about 85 percent and WTI close behind. The products ran harder than the crude, which is its own story for Wednesday: heating oil and diesel up about 118 percent, gasoline up roughly 73 percent. The refiner has been the quiet winner of this whole episode, and the pain you feel at the pump is a refining-margin event as much as a crude event.
Now look at the other barrel. U.S. natural gas at Henry Hub is down about 30 percent over the same twelve months. Not flat. Down. While crude doubled in price terms and diesel more than doubled, the American gas barrel went the other way. If this were a broad energy shock, that number would be positive. It is not. So whatever is happening, it is not happening to energy. It is happening to oil.
Why it is a U.S. story, and only a U.S. story
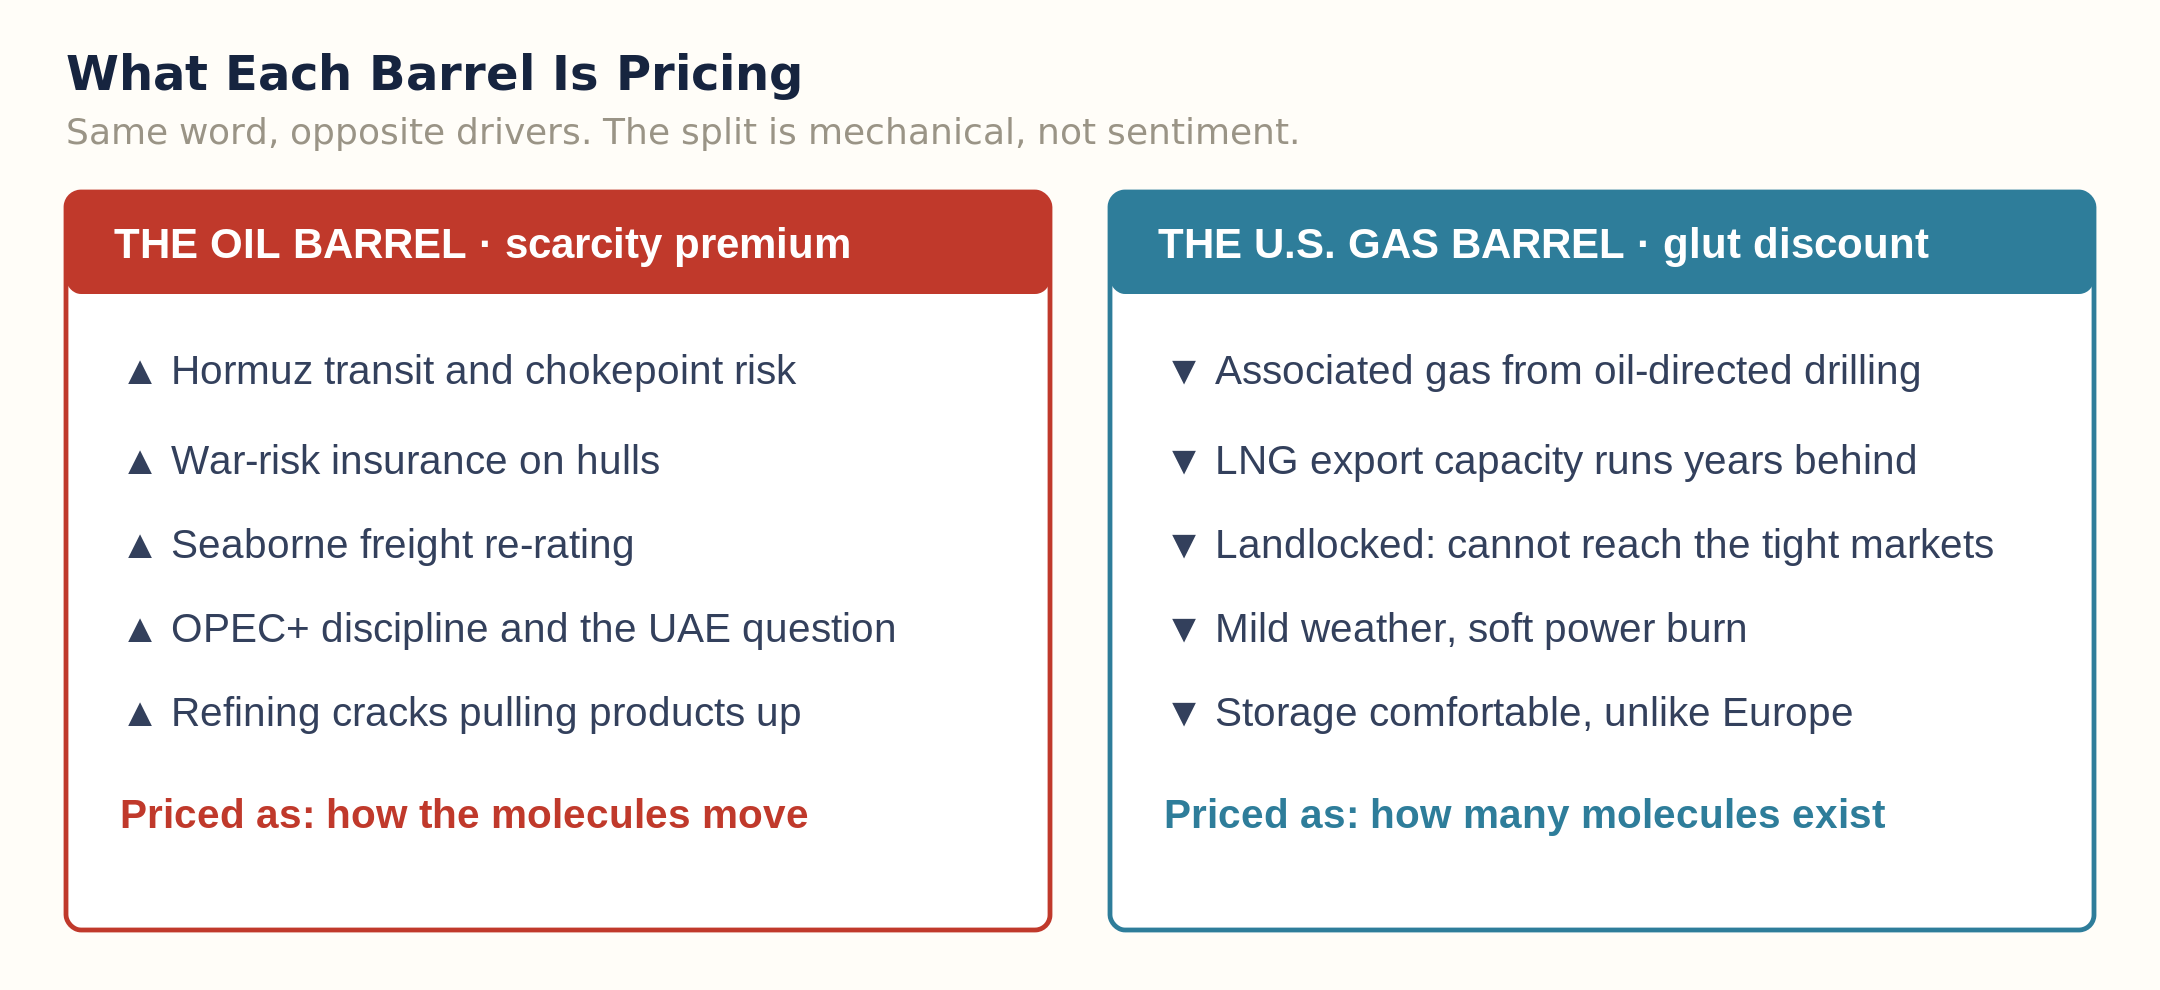
Here is the part the single-line “energy is up” take misses. Gas is not one price. It is three. Henry Hub is the American benchmark, and it is sitting on a shale glut: associated gas keeps coming out of oil-directed drilling whether the gas market wants it or not, and the only export valve, LNG, is capacity-constrained and runs years behind the molecules. The gas is landlocked. It cannot get to the war.
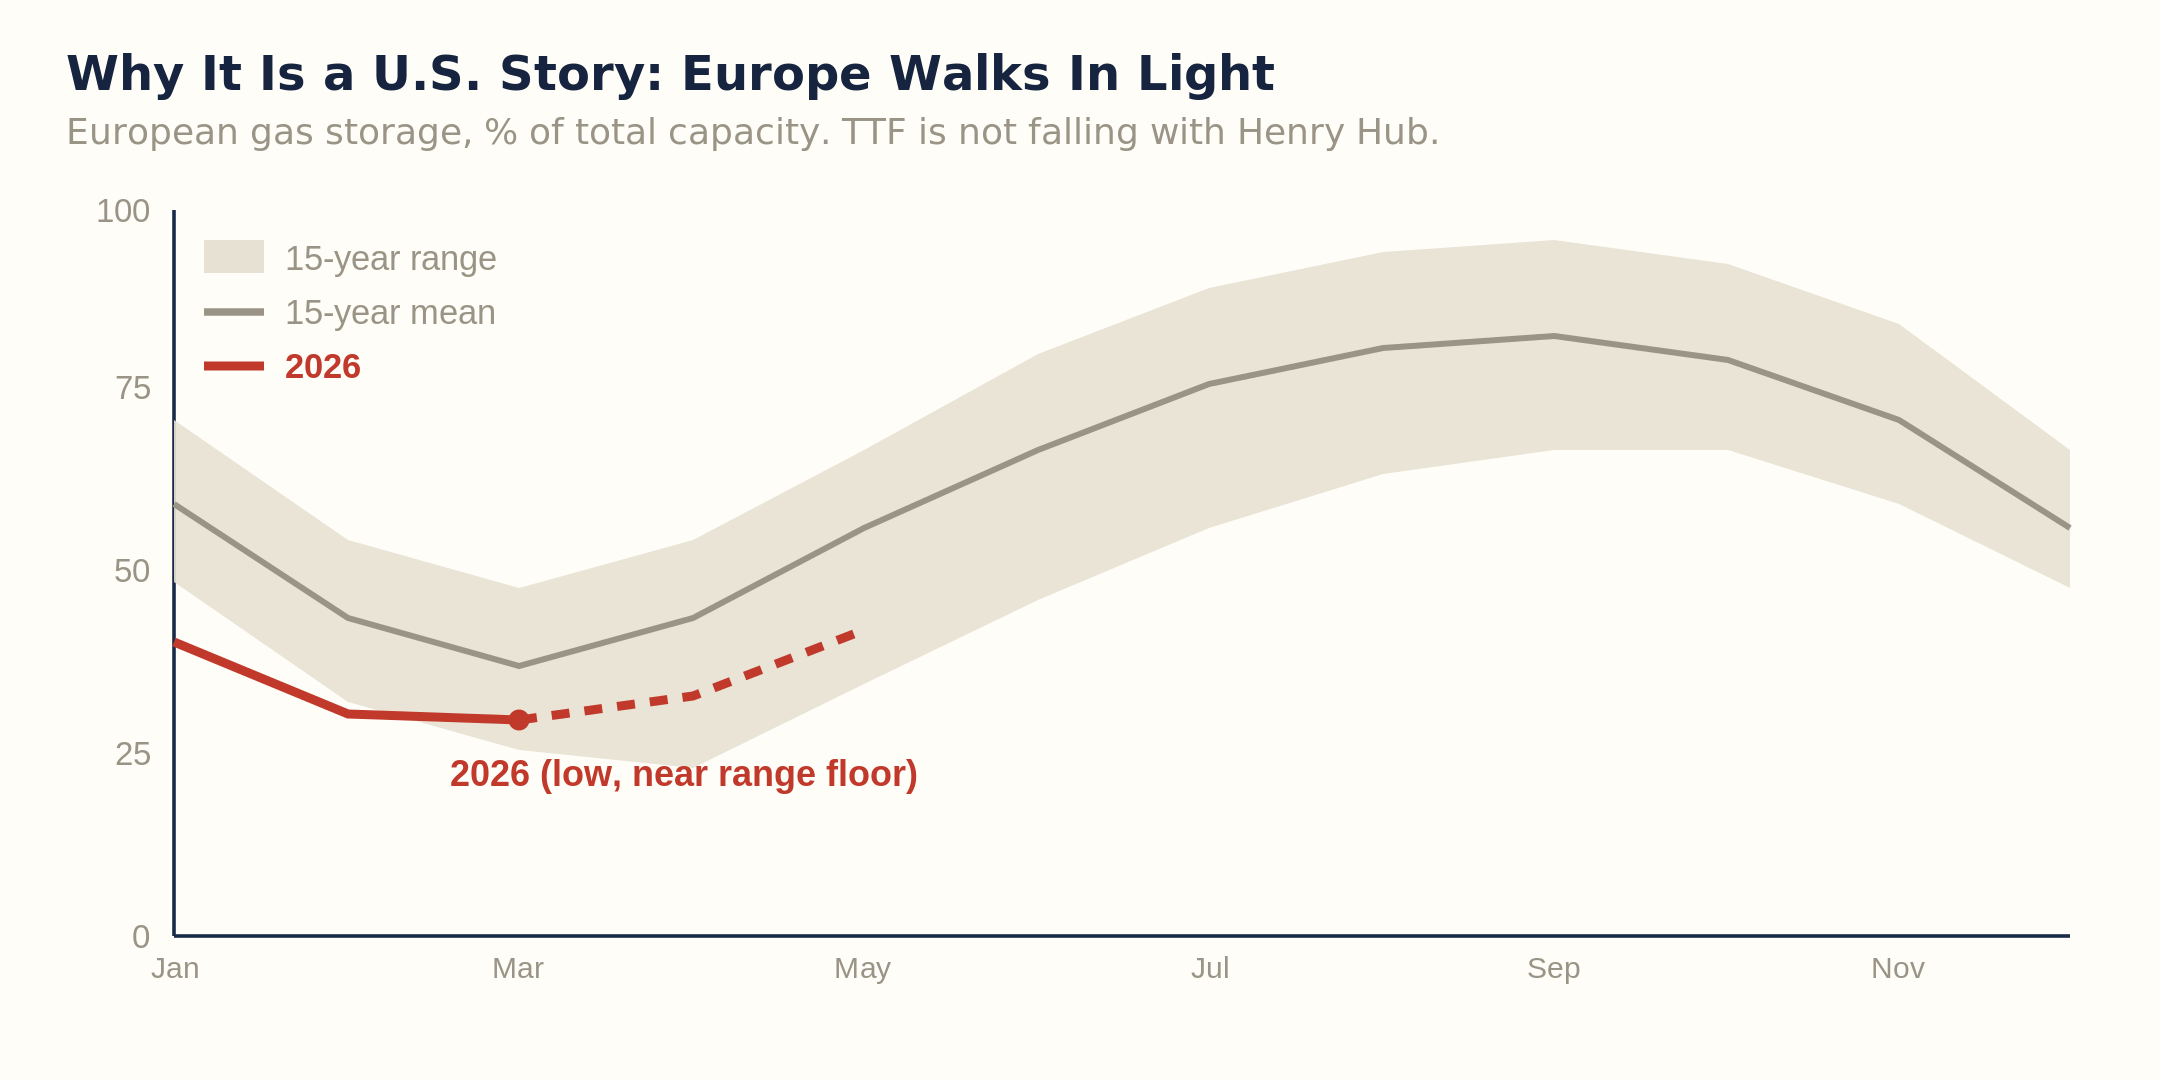
Europe is the opposite. Dutch TTF is not following Henry Hub down, because the continent is walking into this disruption light on storage, the same way it did in 2022. Asian JKM is firm on contracting. Three benchmarks, three stories, one continent of cheap molecules that cannot reach the two that are tight. The divergence is not telling you gas is weak. It is telling you the shock has a postcode, and the postcode is the Gulf and the seaborne oil that moves through it.
What each barrel is actually pricing
Put the two side by side and the asymmetry is structural, not noise. The oil barrel is carrying a war premium that has very little to do with how many molecules exist and everything to do with how they move: the Strait of Hormuz, war-risk insurance, freight, OPEC discipline, and a 60-day memorandum with Tehran that nobody on a trading desk fully trusts. The American gas barrel is carrying the opposite problem. Too much supply, no way out, and weather that has not cooperated.
This is why the ratio between the two is the cleanest single read on the market right now. Oil priced in gas terms has rarely been this expensive. A barrel of Brent now buys an absurd amount of American gas in energy-equivalent terms. That gap is not a forecast. It is a measured fact, and it is the spread that tells you exactly how much of the energy tape is war and how much is fundamentals.
The honest counter-case
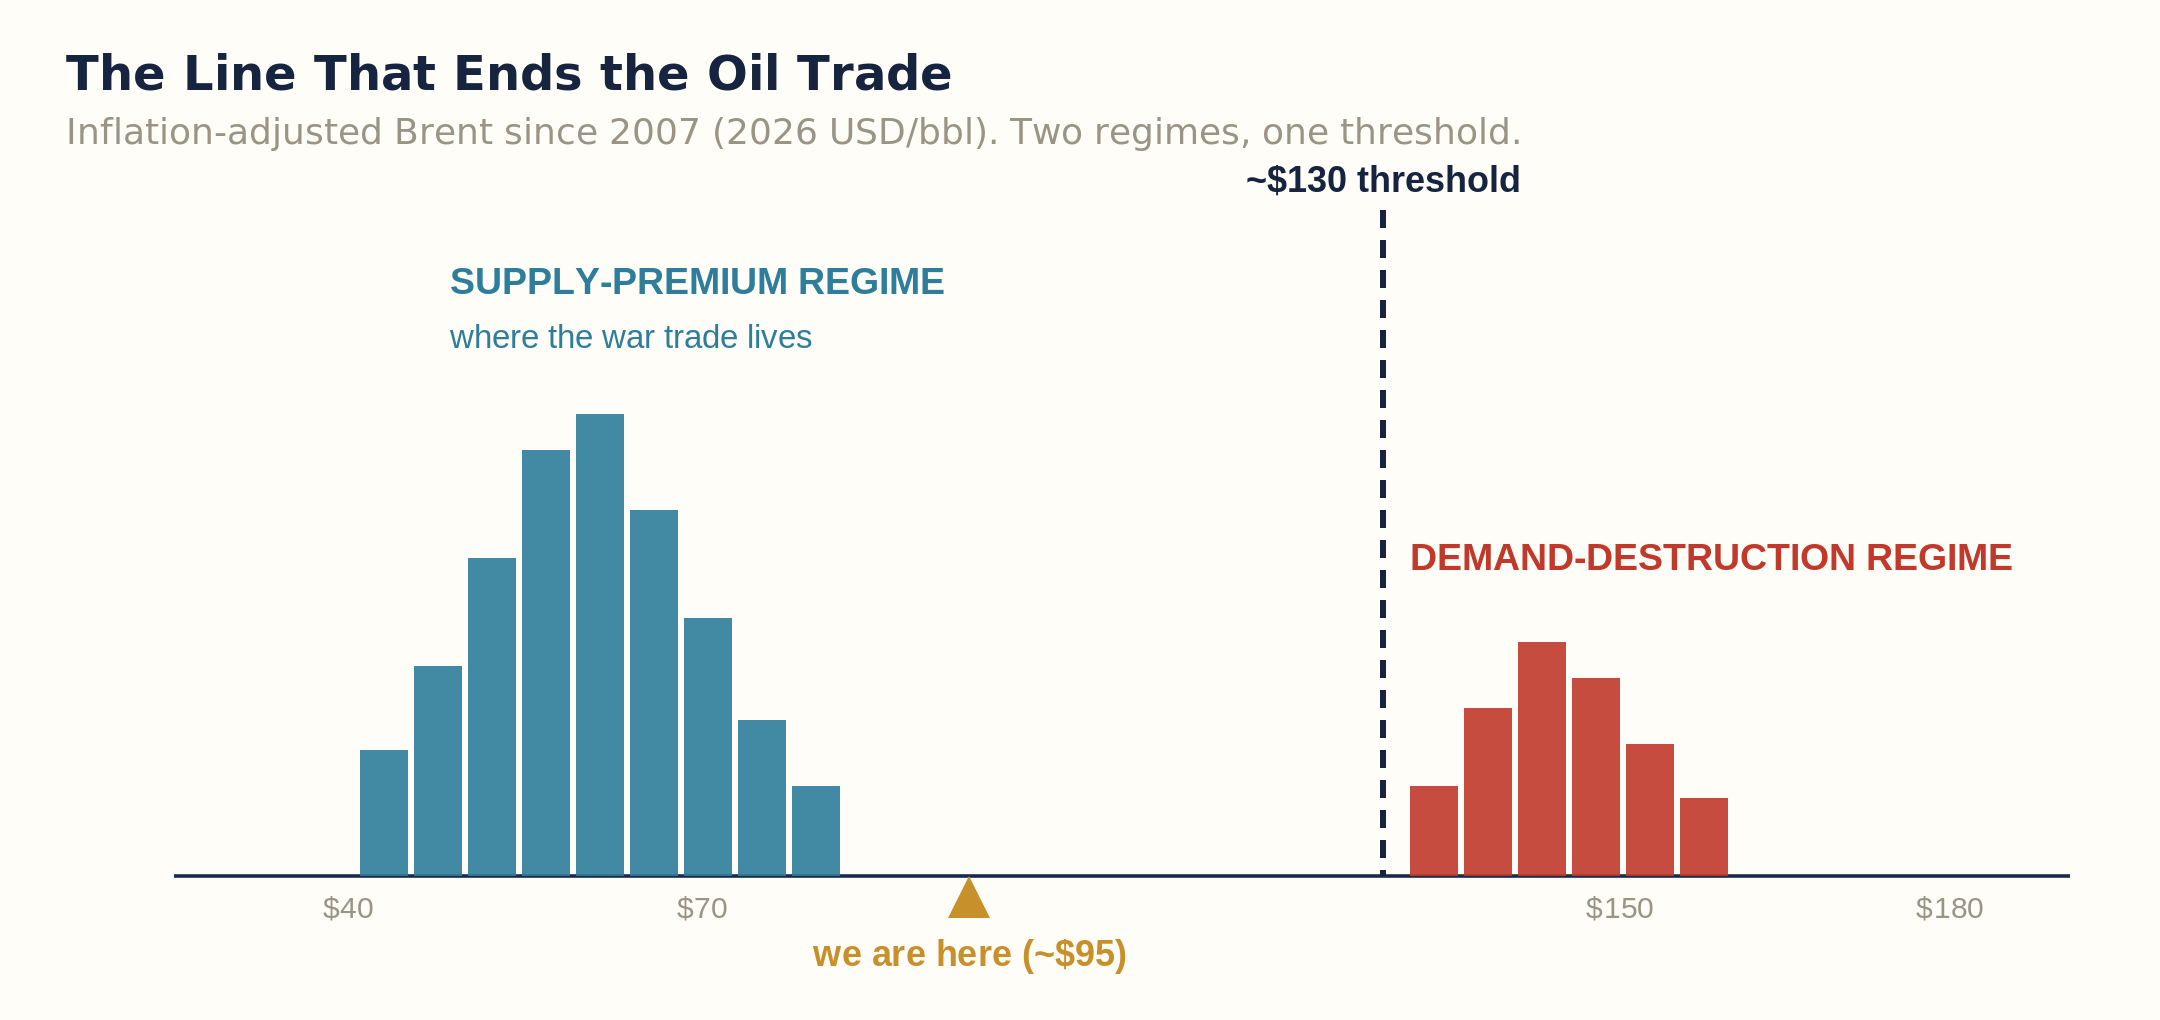
Now the part most of the bullish notes skip. High prices are the cure for high prices, and the cure has a known address. History puts the demand-destruction line for inflation-adjusted Brent somewhere north of $130. Below it, the world grumbles and keeps buying. Above it, demand actually breaks, and the barrel does to itself what no diplomat can do for it. We are not there. We are sitting in the supply-premium zone, which is exactly where a war trade lives until either the war ends or the price gets high enough to kill the demand that justifies it.
So the bear case on the oil leg is not complicated and it deserves respect. The 60-day memorandum holds. Hormuz keeps flowing. The premium that was parked, not removed, finally leaves. Oil rolls back toward the seventies, the ratio closes from the top instead of the bottom, and everyone who chased the flat price at the high gets the usual lesson. If you trade the divergence, that is your risk, and you should know where it lives before you put it on.
So what
The takeaway for the week is one sentence. Stop trading “energy” as a single direction. The clean expression of everything above is the oil-to-gas ratio, long the barrel that is pricing a war against the barrel that is pricing a surplus. It is not a flat-price bet, which is the point. You are not betting Brent goes to 120. You are betting the two barrels stay in different worlds for as long as Hormuz stays a question. The level where that view is wrong is the demand-destruction line above and a signed, enforced Iran framework below. Both are visible. Neither is here yet.
The rest of the week builds on this split. Wednesday’s flagship goes to the place the American gas glut might actually find a buyer, and it is not the one the equity desks are shouting about. Friday moves the lens to Europe and the central bank that has to raise rates into the exact gas exposure Chart 2 shows. The two off-cycle notes take the divergence into fertilizer and into the map of who pays if the memorandum breaks.
This week’s Signal ships with a 9-slide desk pack. Two slides worth your time before the open: the oil-to-gas ratio with the entry and the invalidation level marked, and the LNG export-capacity wall that keeps the American glut landlocked through 2027. The Signal is free in full. The Flow and the Horizon sit behind the wall. Founding $25 / Monthly $8.
Best Regards,